Data Analysis & Visualization
You can use this feature to analyze and visualize GIS data within a region. Various types of analyses can be performed and the results can be visualized in the map itself.
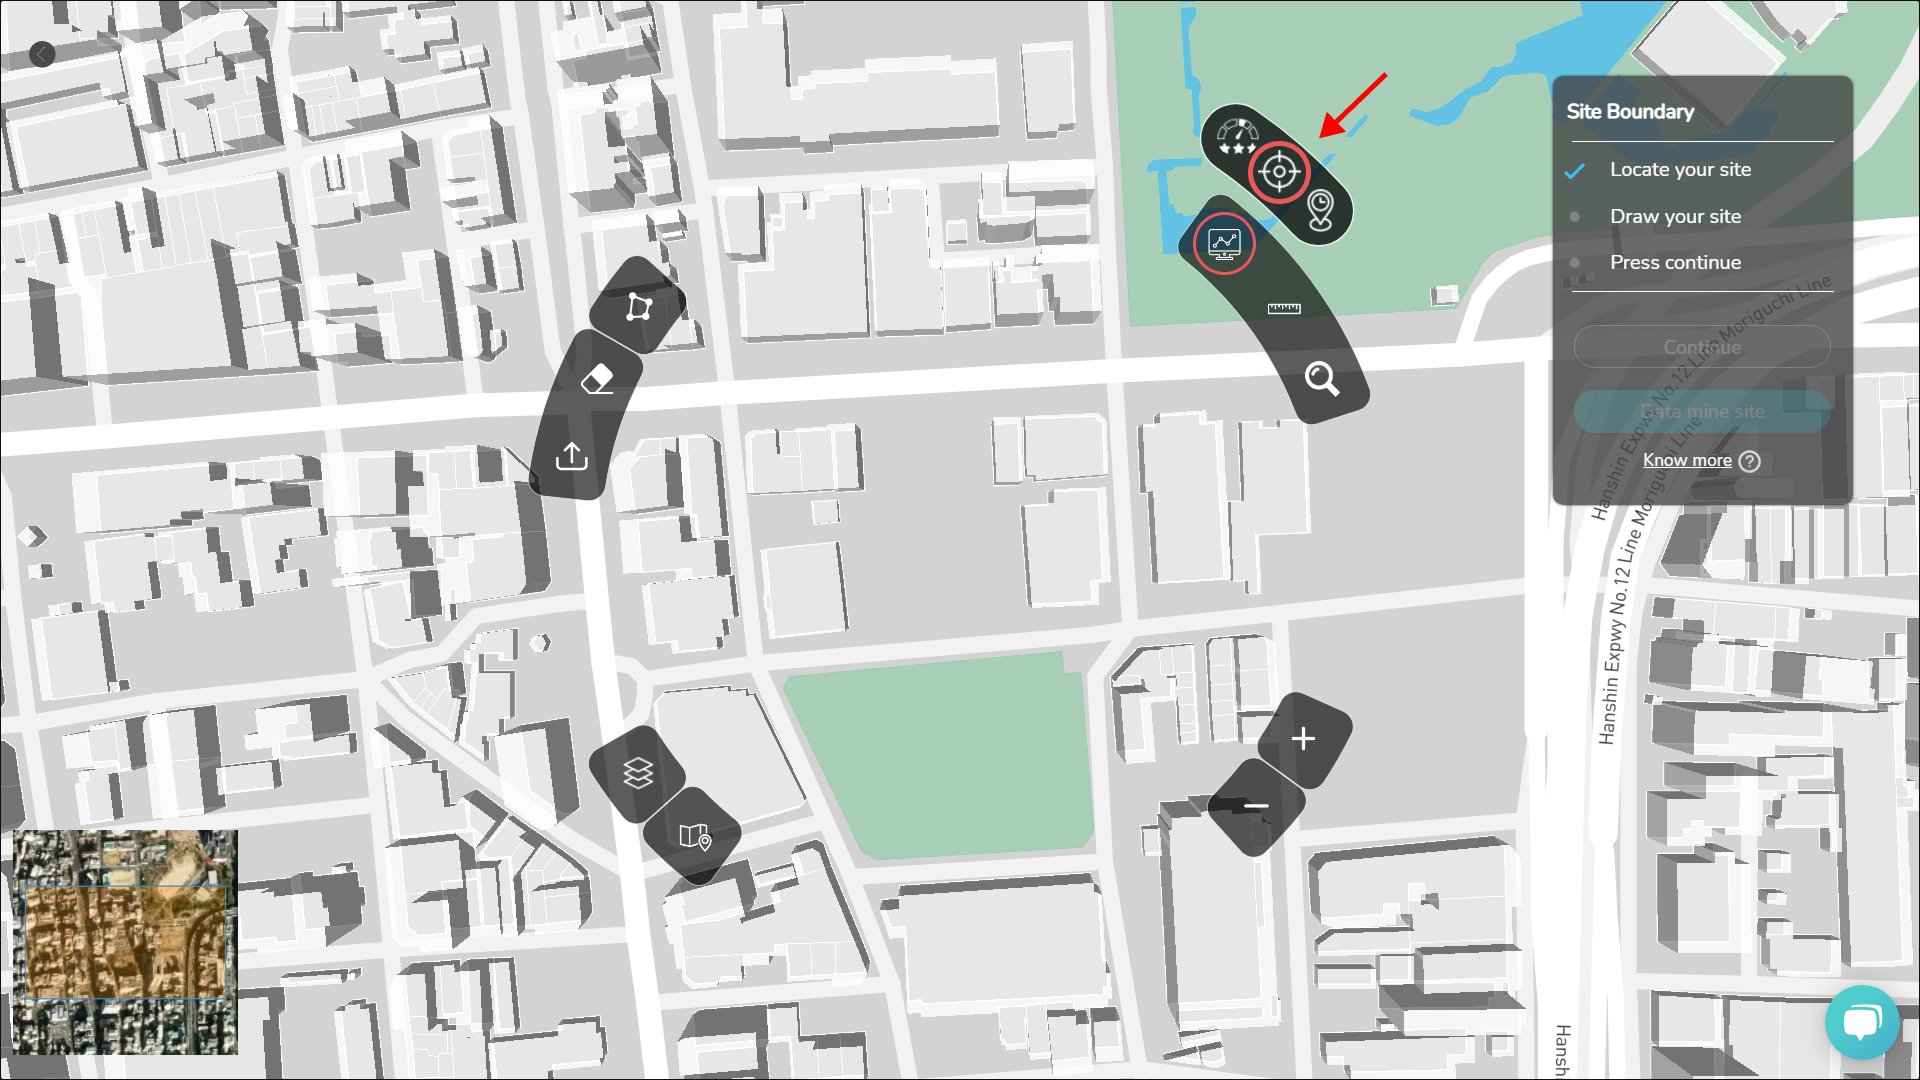
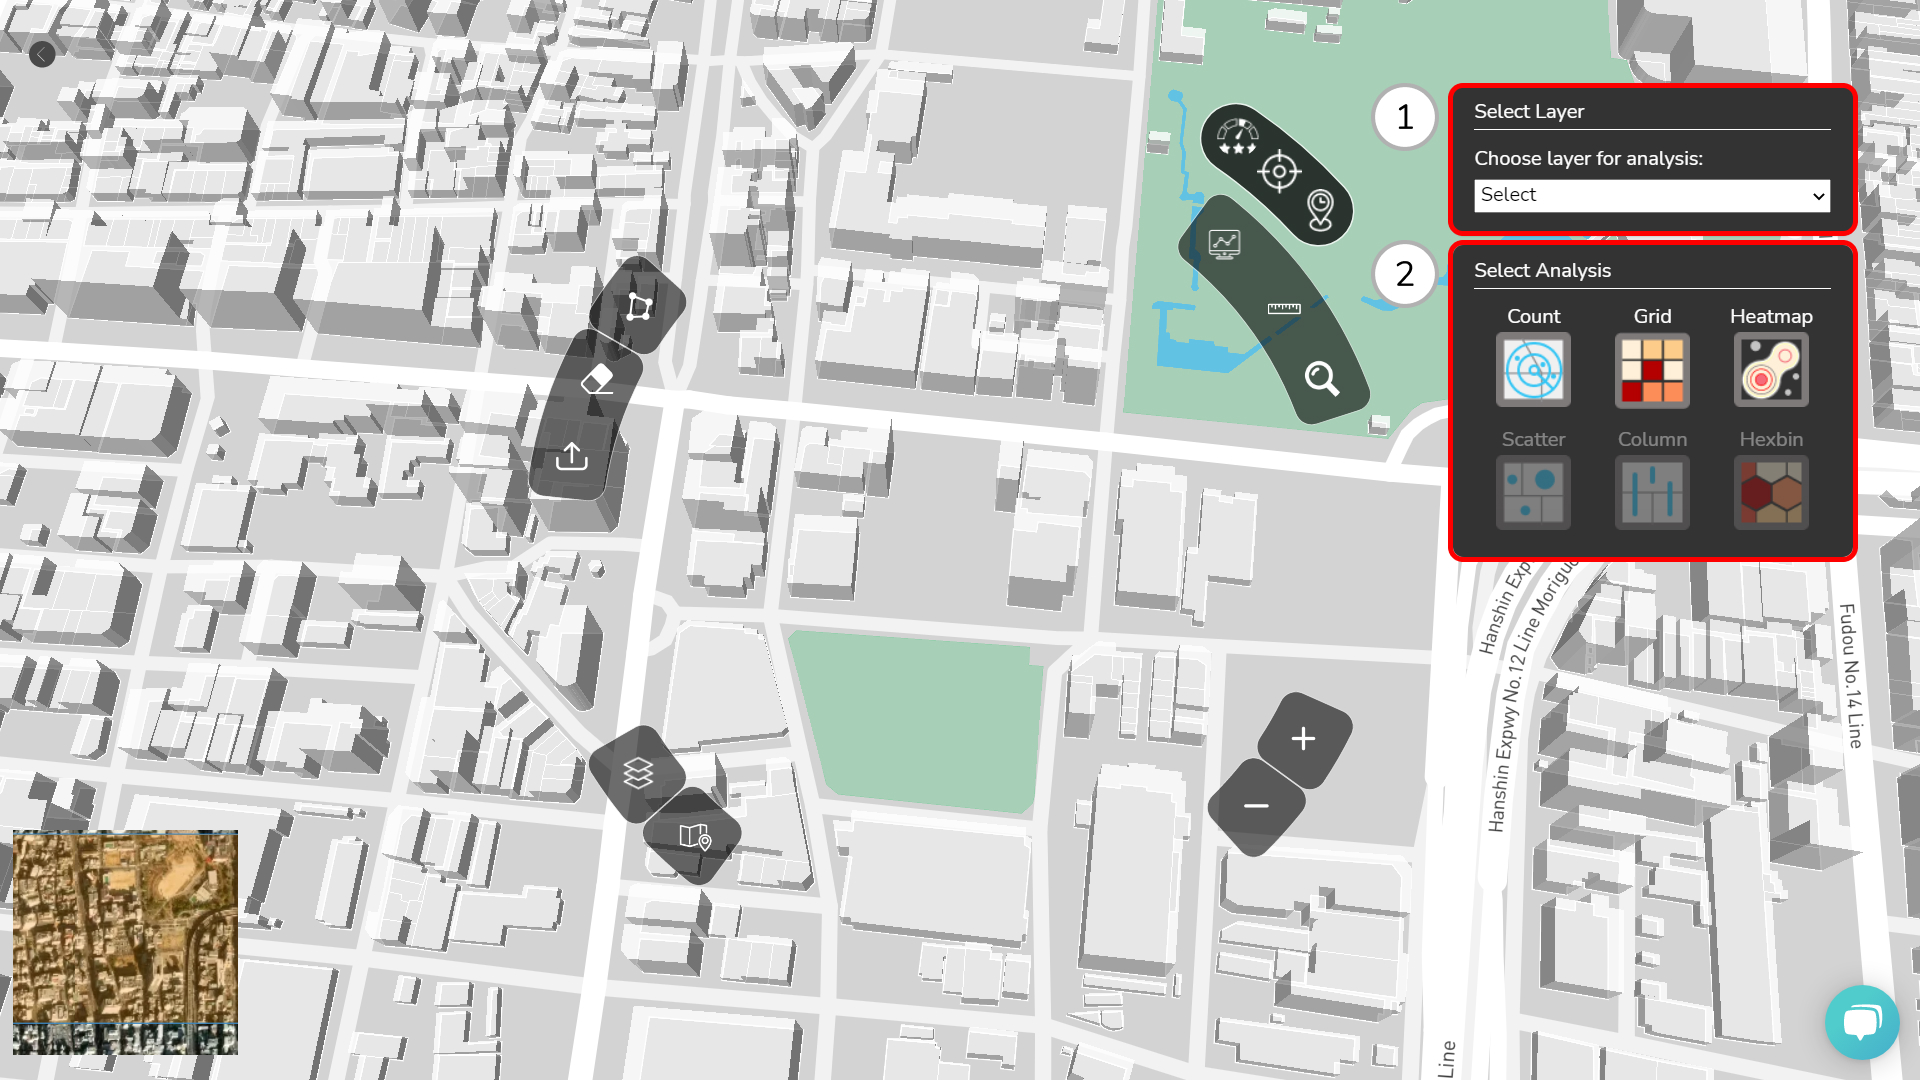
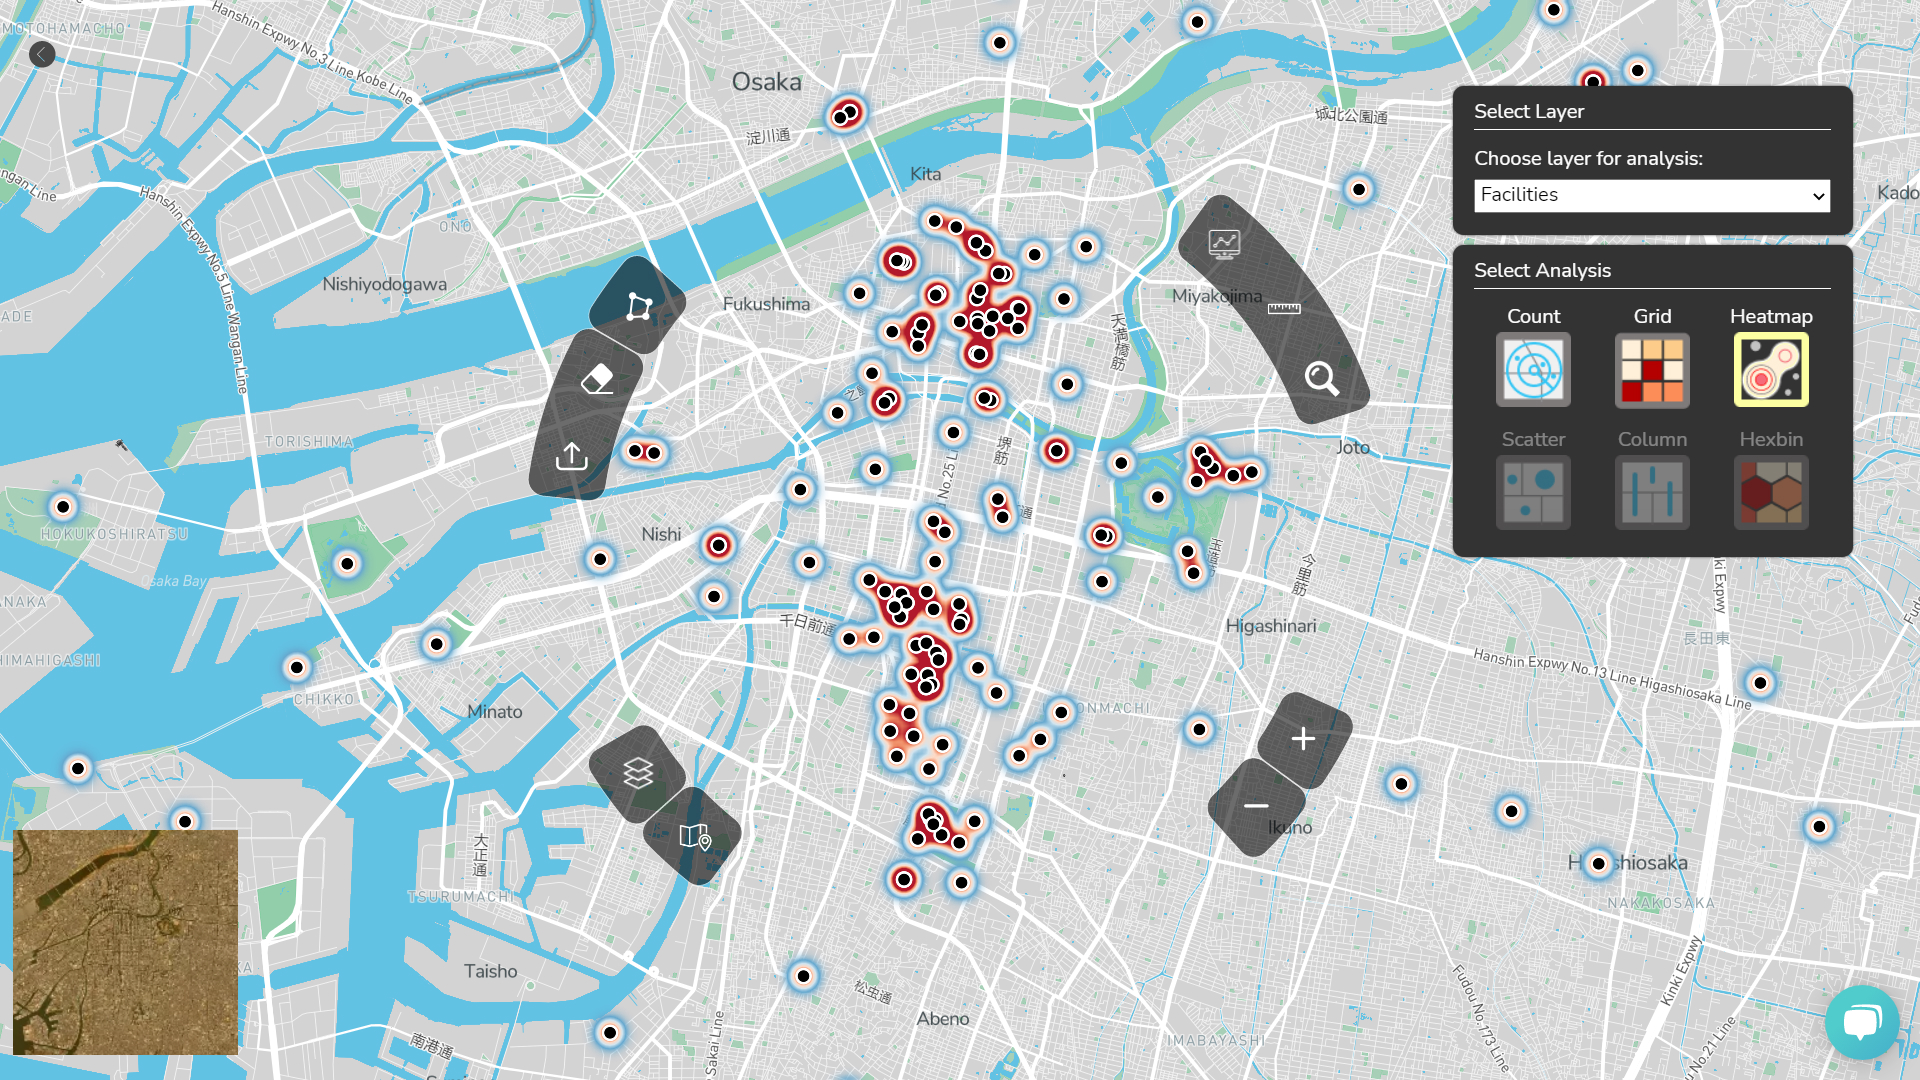
1. Select Layer
Select the data layer for analysis from the different options available.
2. Select Analysis
Choose the analysis type from the options available;
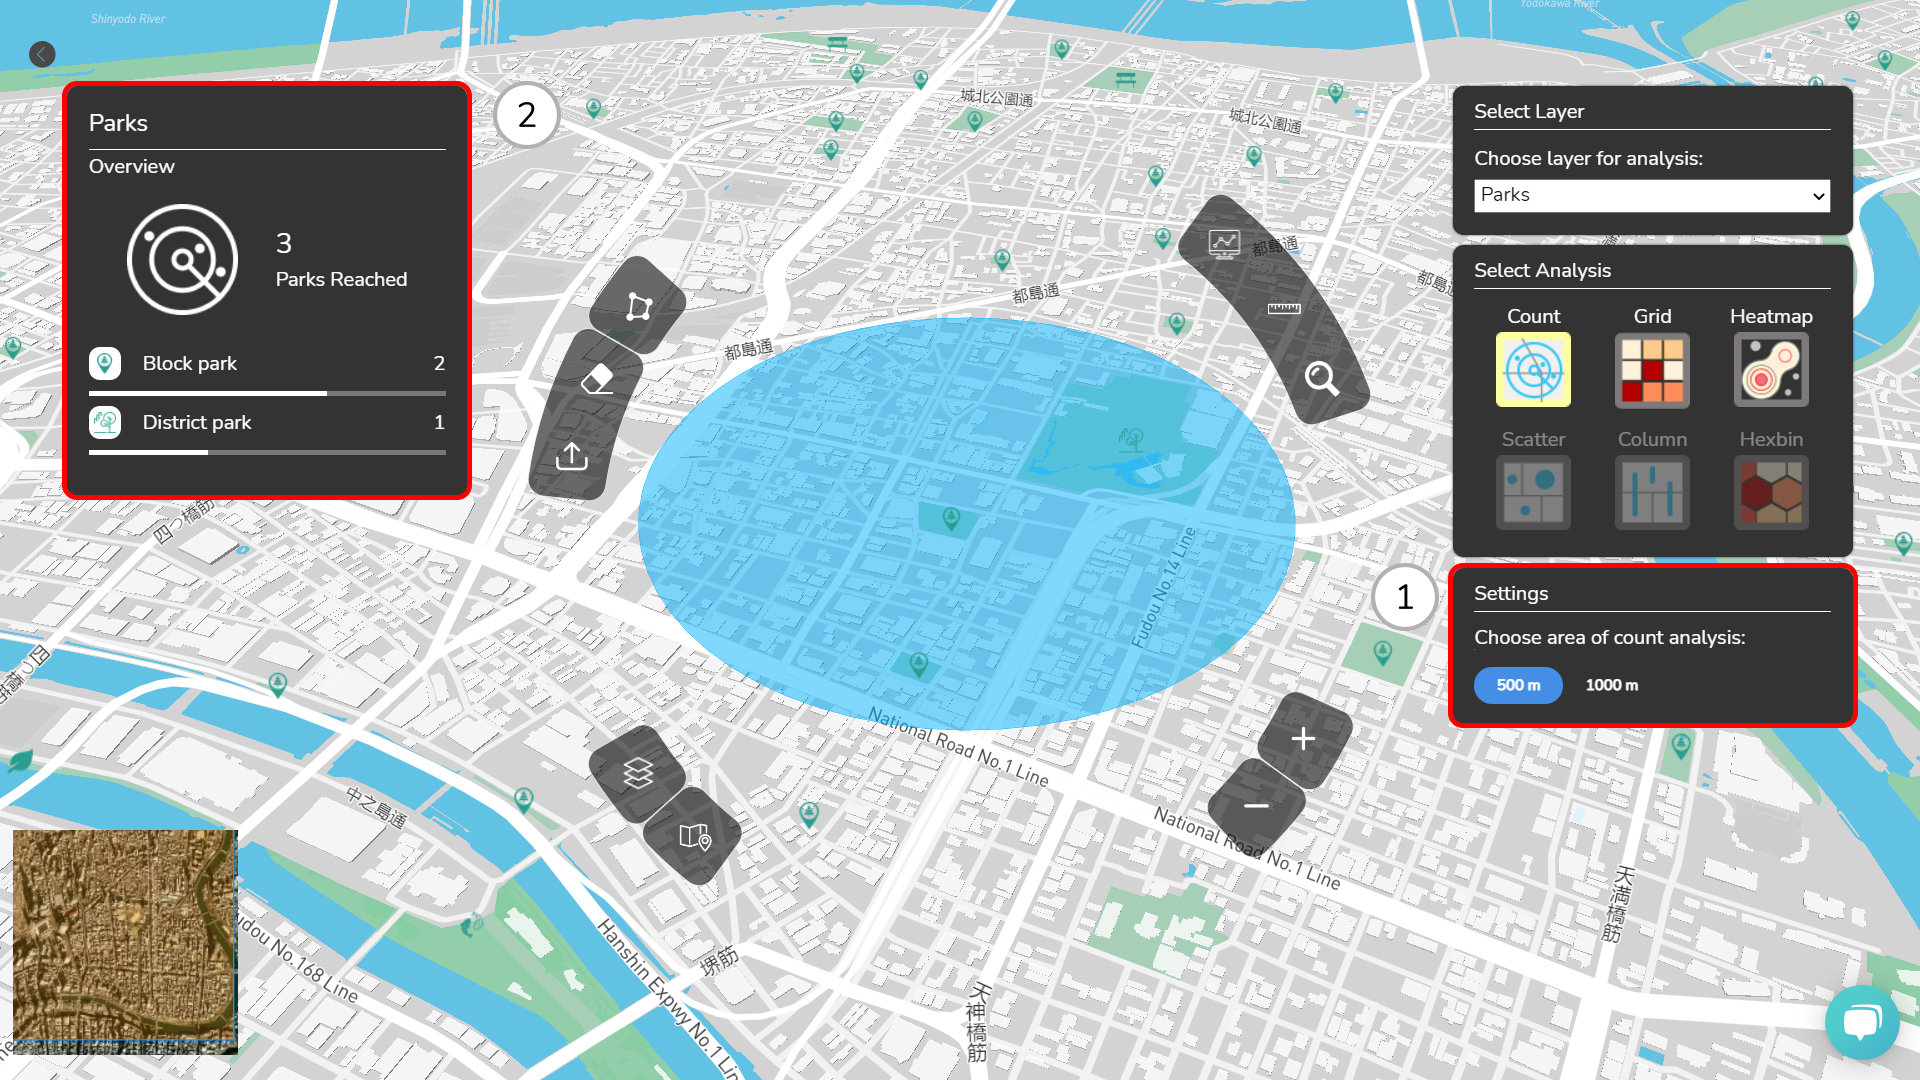
- Count
Once you have selected the data layer for Count analysis,
- You can choose the area from the available options, 500m or 1000m.
- On the left side panel, you can see the distribution of different types of facilities for the selected area.
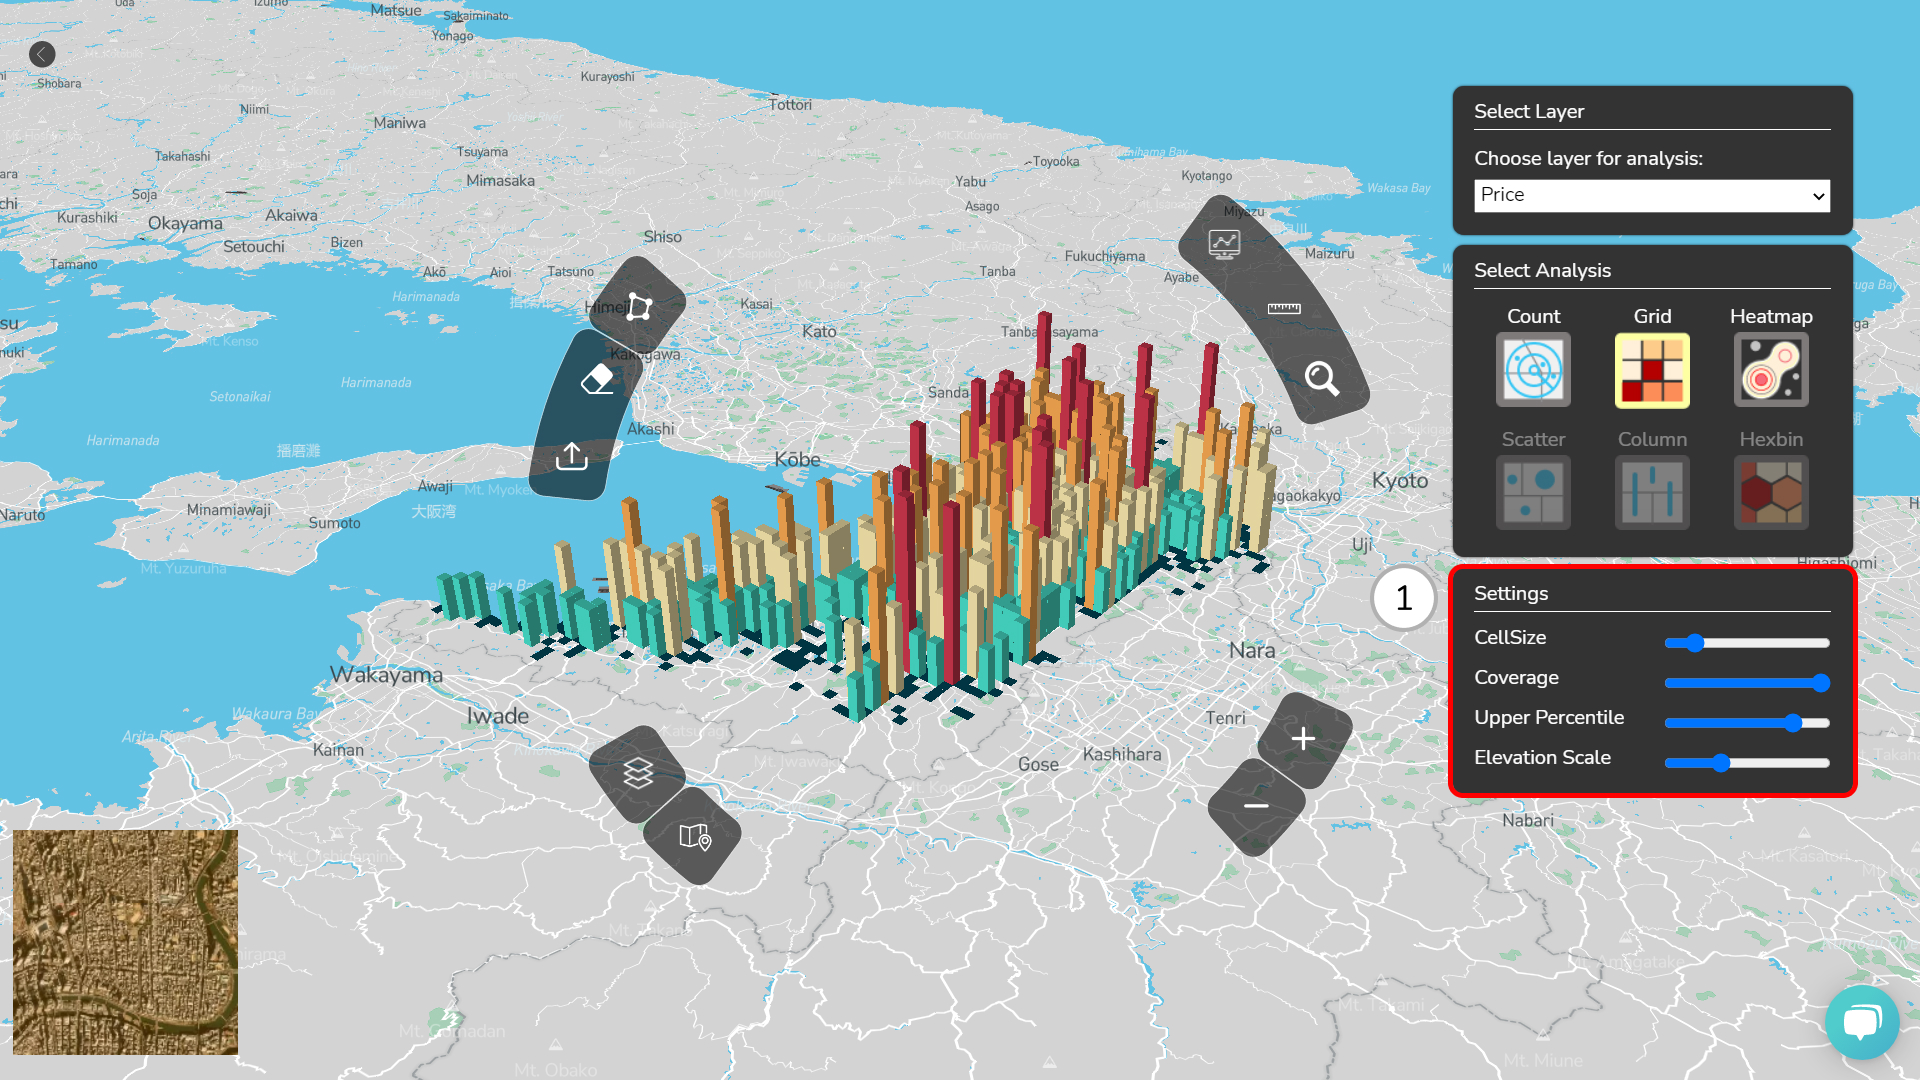
- Grid
In this type of analysis, you can control different parameters for the data visualization. The setting parameters can be controlled by sliders.
- Heatmap
In this type of data analysis, the selected data layer is visualized showing the magnitude or concentration of features using colors.
- Scatter (Coming soon)
- Column (Coming soon)
- Hexbin (Coming soon)